This project is heading towards its end. There are still four weeks left of the 20 week exhibition period though. I have trampled a path which is now, with all its windings, divisions and loops, about one hundred meters long. I will prolong the path with four new meters until the 5th of November. The mean temperature is going down quite fast now. The line will probably end quite close to the last plane three.
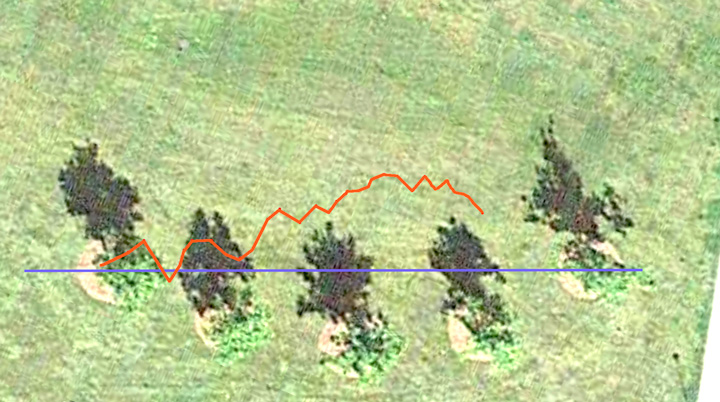
This is a Google maps image with the five plane threes. I added a temperature curve, drawn by hand. Blue is zero degrees Celsius. The orange curve shows, left to right, the mean temperature on a weekly basis, from January through today, the 15th of October. The path is based on this curve. I have hoped for Google to take an image of the path from above, but not yet.